Best Greyhound Betting Sites – Bet on Greyhounds in 2026
Loading...
The Clock Doesn’t Lie — But It Doesn’t Tell the Whole Story Either
A greyhound’s overall race time tells you how fast it covered the distance. Sectional times tell you how it covered the distance — where it was fast, where it was slow, and what that pattern reveals about its running style, its fitness, and its suitability for different race scenarios. In a sport where the difference between first and third can be a quarter of a second, sectionals are the diagnostic tool that separates serious form analysis from guesswork.
This article explains what sectional times are, how to read them on a racecard, and — most importantly for Derby punters — how to use them to compare dogs whose overall times might look identical but whose racing profiles are fundamentally different.
What Sectional Times Measure
Sectional times break a race into segments, typically two: the time from the traps to the first bend (the first-bend split or “split”) and the time from the final bend to the finishing line (the run-home time). Some tracks and data providers also record intermediate sectionals through the middle of the race, but the first-bend split and run-home are the two most widely available and most analytically useful figures.
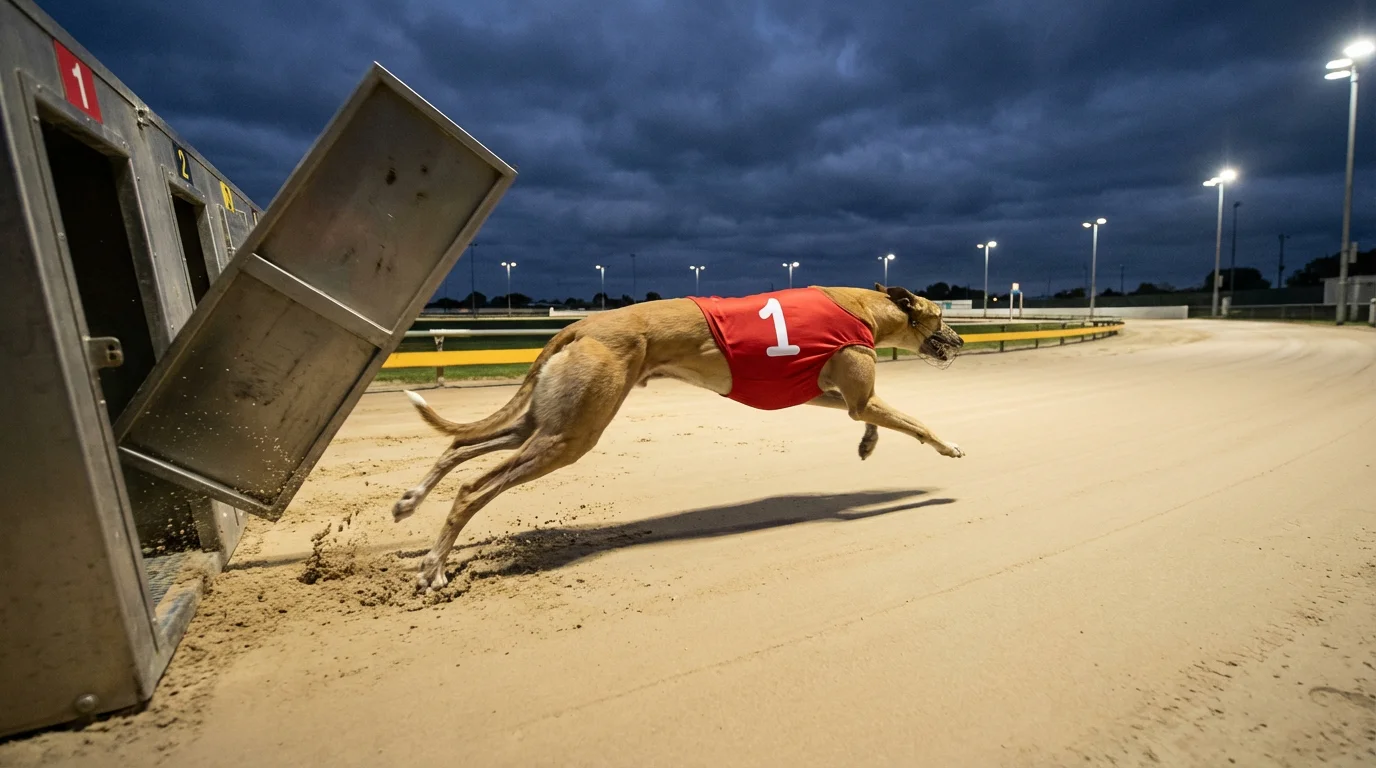
The first-bend split measures early pace. It captures how quickly a dog leaves the traps, accelerates to full speed, and reaches the first turn. In a six-dog race, the first-bend split is the closest thing to a measure of box speed and initial acceleration — the two factors that most directly determine where a dog sits at the critical first bend, which in turn shapes the entire race.
A fast first-bend split — say, under 5.00 seconds at Towcester — identifies a dog with genuine early pace: one that is likely to be at or near the front by the first turn. A slower split — above 5.20 — suggests a dog that either starts slowly, lacks sharp acceleration, or is drawn wide enough that it has further to travel before the timing point. Both numbers need context: a 5.10 from trap one means something different from a 5.10 from trap six, because the trap-six dog has covered more ground to reach the same timing point.
The run-home time measures finishing speed. It tells you how fast the dog covers the final straight after the last bend, and it’s the best indicator of a dog’s ability to finish a race strongly. A quick run-home time combined with a moderate first-bend split identifies a closer — a dog that conserves energy early and accelerates late. A fast split combined with a slow run-home identifies a front runner that fades. The combination of both numbers gives you a more complete picture of the dog’s racing profile than the overall time alone.
Together, the split and run-home time should approximately equal the overall race time (with the middle section accounting for the remainder). If the two sectionals add up to significantly less than the overall time, the dog lost time through the middle bends — possibly due to crowding, checking, or running wide. That discrepancy can flag a run that was better than it looked on the clock.
How to Read and Compare Sectional Splits
The first rule of sectional comparison is that splits are track-specific. A 4.95 first-bend split at Towcester is not equivalent to a 4.95 at Romford or Hove, because the distance from the traps to the first timing point varies between venues. Each track’s sectional data exists in its own ecosystem, and meaningful comparison requires comparing dogs that have run at the same track — or, at minimum, applying a track-specific adjustment that accounts for the geometrical differences.
For Derby purposes, this simplifies the task considerably, because every dog in the competition races at Towcester. Heat-by-heat, the sectional data is directly comparable: if dog A clocked a 4.98 split in its first-round heat and dog B clocked 5.08, you know that dog A was quicker to the first bend on the same track under equivalent conditions. That difference of a tenth of a second translates to roughly a length of advantage at the first turn — enough to determine who leads and who chases.
Consistency matters as much as absolute speed. A dog that posts splits of 4.98, 5.01, 5.00, and 4.99 across four rounds is reliably fast out of the traps. One that posts 4.92, 5.15, 5.02, and 5.18 has breakneck speed on its best day but cannot reproduce it consistently. In a Derby final, where the first bend is contested by six proven runners, reliability is more valuable than a single spectacular number. The dog that finds 5.00 every time is a safer bet than the one that occasionally finds 4.90 but might equally find 5.20.
Run-home times follow the same principle. Look for consistency across rounds rather than a single fast figure. A closing run-home time that appears once might reflect a race where the front-runners faded unusually early. A consistently quick run-home across multiple heats against different opposition confirms genuine finishing ability.
Towcester Benchmarks: What Good Looks Like
At Towcester’s 500-metre circuit, the benchmarks for sectional quality in Derby-class racing sit roughly as follows. A first-bend split under 5.00 seconds is sharp and places a dog among the fastest starters in the field. Between 5.00 and 5.10 is competitive — the dog will be in the leading group at the first bend but not necessarily clear of it. Above 5.10 marks a dog that is likely to be mid-pack or worse at the first turn, relying on closing speed to make up the deficit.
For run-home times, the benchmarks depend partly on the pace of the race — a slowly run race compresses the field and makes run-home times faster because every dog finishes relatively fresh. In a genuinely competitive Derby heat run at honest pace throughout, a run-home time under 10.00 seconds is strong, indicating a dog that is still accelerating (or at least maintaining speed) through the final straight rather than decelerating.
Overall race times at Towcester for Derby-class dogs typically fall in the 29.00 to 29.60 range, depending on track conditions. A sub-29.20 run in a competitive heat — not a solo trial, not a soft lead against weak opposition — is an elite performance. Several Derby finals have been won in times around 29.30 to 29.50, which reflects both the quality of the opposition and the slightly conservative pace that six cautious dogs tend to set when each knows the other five are dangerous.
Conditions matter. A rain-softened track at Towcester can add two to four tenths to both the split and the overall time. If you’re comparing sectionals across rounds, check whether track conditions were consistent. A dog that ran 4.98/29.25 on a dry night and then ran 5.08/29.55 on a wet night hasn’t necessarily slowed down — the surface has changed, and the slower numbers may represent an equivalent or better effort on heavier going.
Sectionals Are the X-Ray — the Overall Time Is the Photograph
An overall race time gives you the headline. Sectional times give you the story underneath it: which dog led, which closed, which lost time through trouble, and which ran a race that was better — or worse — than the clock suggests. For Derby betting, where the form evidence from five or six rounds of racing gives you a rich sectional dataset for every finalist, ignoring that data is leaving your most precise analytical tool in the drawer.
Before the next Derby final, pull the sectional times for every heat, quarter-final, and semi-final each dog has run. Map the pattern. Identify who starts fast consistently, who finishes fast consistently, and who depends on a specific draw or a specific pace scenario to produce their best numbers. The dog whose sectionals tell a coherent, repeatable story is the one most likely to reproduce its form when the stakes are highest.